This package provides the raw data, analysis code, and outputs as well as the computational environment needed to reproduce the project/compendium “drakepkg”. The project uses the R package drake to define a reproducible processing pipeline linking inputs to outputs/targets similar to GNU make (for more information on the drake package, see here). This vignette describes how to reproduce the analysis, check the analysis pipeline, and inspect analysis steps and outputs.
Copy the analysis directory structure
library(drakepkg)
#> Loading required package: drake
copy_analysis()
#> Copying analysis directory structure...
After attaching the package, executing the function copy_analysis() copies the analysis directory structure to the current working directory (or an explicitely specified directory). The directory should now contain the following files:
.
└── analysis
    ├── data
    │   └── other-iris.xlsx
    ├── manuscript
    │   └── report.html
    └── templates
        └── report.Rmd
These files represent all input files required to reproduce the analysis as well as all output files generated in the process. The function further copies the .drake directory to the same directory. This hidden directory stores information about the consistency of the analysis pipeline and all intermediate outputs.
Reproduce the analysis
Reproducing the analysis can be done in a two-step procedure:
- Executing the function
reproduce_analysis()copies the analysis directory structure (if it isn’t already present) and then runsdrake::make(). The output provides evidence of reproducibility without actually re-running the analysis. If the analysis is reproducible, the output should look like this:
reproduce_analysis()
#> Reproducing analysis included in package 'drakepkg':
#> Analysis directory structure is already in place.
#> Checking consistency of provided analysis...
#> All targets are already up to date.- To independently re-create the analysis results on ones own computer, one can run
reproduce_analysis()with the optionre_run = TRUE. This will delete the copied.drakefolder and re-run the entire project from scratch, re-creating all relevant intermediate steps and outputs.
Explore the analysis pipeline and results
Executing get_plan() returns the underlying drake plan used to run the analysis. The returned tibble lists all intermediate results (targets), the commands executed to create them, and the dependencies between them.
plan <- get_plan()
plan
#> # A tibble: 5 x 2
#>   target     command
#>   <chr>      <chr>
#> 1 raw_data   "readxl::read_excel(file_in(\"analysis/data/other-iris.xlsx\…
#> 2 ready_data dplyr::mutate(raw_data, Species = forcats::fct_inorder(Speci…
#> 3 hist       create_plot(ready_data)
#> 4 fit        lm(Sepal.Width ~ Petal.Width + Species, ready_data)
#> 5 report     "rmarkdown::render(knitr_in(\"analysis/templates/report.Rmd\…
The drake package provides several ways to visualize the project, e.g.
Furthermore, drake provides functions for viewing individual targets (drake::readd()) or load them into the current environment (drake::loadd()). For example, to view the cleaned data frame, use
readd(ready_data) %>%
head()
#> # A tibble: 6 x 5
#> Sepal.Length Sepal.Width Petal.Length Petal.Width Species
#> <dbl> <dbl> <dbl> <dbl> <fct>
#> 1 5.1 3.5 1.4 0.2 setosa
#> 2 4.9 3 1.4 0.2 setosa
#> 3 4.7 3.2 1.3 0.2 setosa
#> 4 4.6 3.1 1.5 0.2 setosa
#> 5 5 3.6 1.4 0.2 setosa
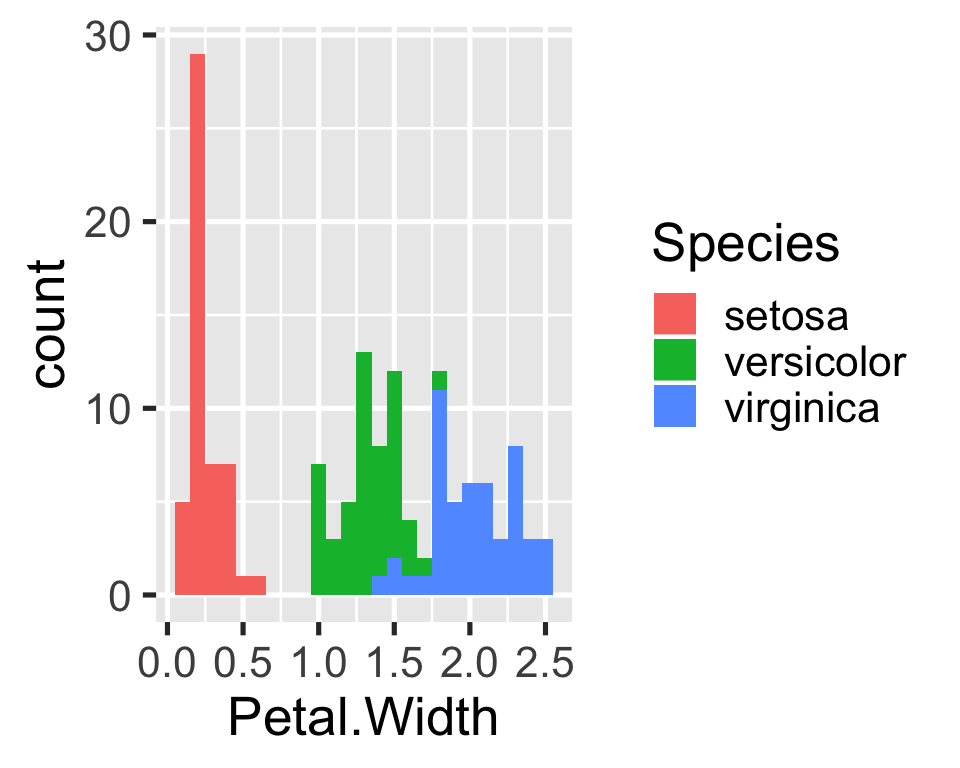
#> 6 5.4 3.9 1.7 0.4 setosaor to view the figure included in the report, use
Cleaning up
Executing delete_analysis() removes the analysis and .drake directories from the working directory (or an explicitely specified directory).